Prepared by Jongsun Won, PE, Betsy LaRue, PTV America, Inc.
The purpose of this page is to provide a clear understanding on how speed elements are used in PTV Vissim and to learn how to create PTV Vissim objects related to speed.
Table of Contents
First, it is important to understand the difference between the two concepts of speed below:
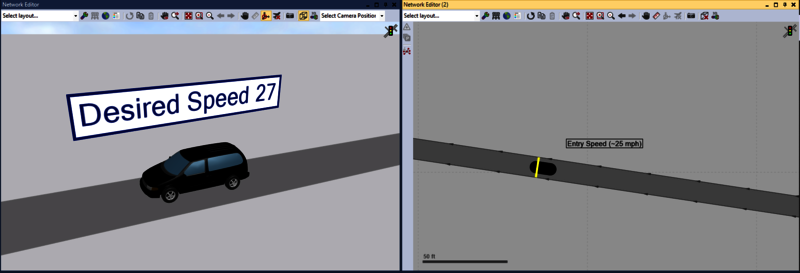
- Desired Speed
- Actual Speed
When you are driving, there are certain components which will determine the level of speed that you can maintain. It will consist of the design (i.e. horizontal curve, vertical curve, super elevation) speed, level of aggressiveness, interruption of surrounding vehicles (i.e. congestion, traffic signal, stop signs), and more. If you are the only one traveling on the roadway, you will be able to travel at the speed level solely determined by the roadway design and your aggressiveness level. The speed that you will be traveling in this condition is “desired speed”, also known as free flow speed. In reality, however, you cannot maintain your “desired speed” because of many different types of friction, such as traffic signals and slow-moving vehicles. In this case, the adjusted speed is known as your “actual speed”.
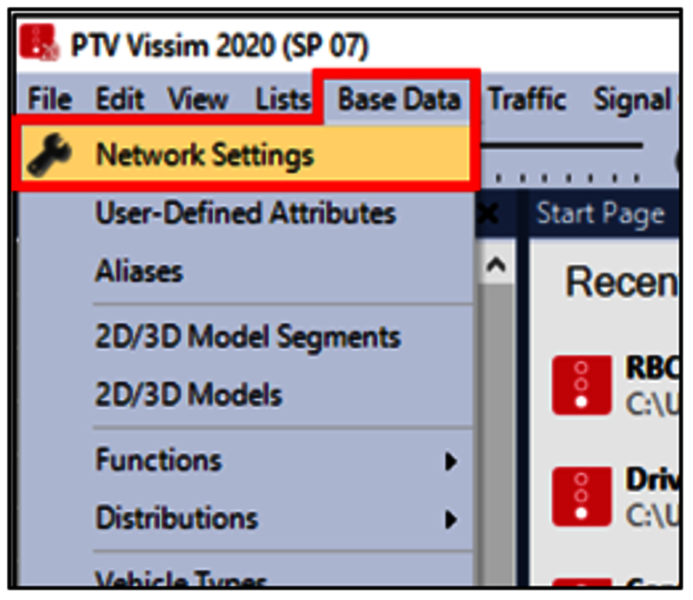
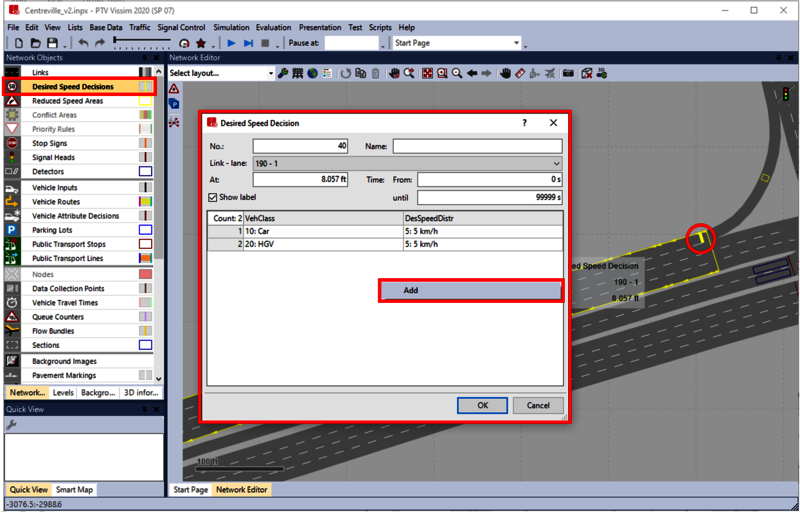
In PTV Vissim, you can only enter the “desired speed”, while “actual speed” can be measured as an output after the simulation runs. This page will cover details on the user input side of the speed, rather than the output. With this in mind, we will go into further details in following sections.